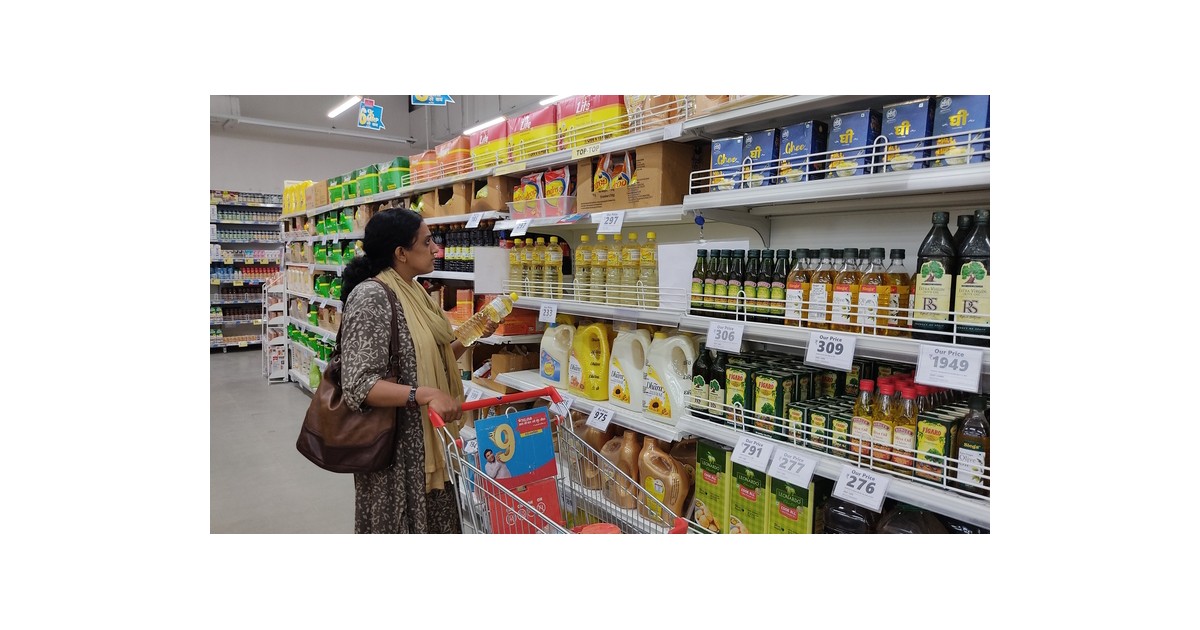
The affordability of a healthy diet varies significantly based on food prices, nutritional needs, incomes, and broader economic conditions, according to recent estimates from the Cost and Affordability of a Healthy Diet (CoAHD) report. This data, produced by the Food and Agriculture Organization of the United Nations (FAO) and the World Bank Group, is featured in the United Nations’ annual report, The State of Food Security and Nutrition in the World 2026.
Read More
In 2025, the global average cost of a healthy diet, defined as the minimum expenditure necessary to purchase a basket of locally available foods meeting dietary guidelines, reached 4.28 Purchasing Power Parity (PPP) dollars per day. Approximately 2.7 billion people, or one-third of the world’s population, were unable to afford this diet. The cost of healthy diets differs markedly across World Bank income groups. In 2025, lower-middle-income countries faced the highest average at 4.36 PPP dollars per person daily, a 47.8 percent increase since 2017. High-income countries also saw a significant rise, with costs increasing by 3.5 percent to 4.20 PPP dollars, and a total increase of 47.9 percent since 2017. Conversely, low-income countries experienced a decline in costs after a peak in 2023.
Regionally, Latin America and the Caribbean had the highest diet costs, averaging 4.91 PPP dollars per day, while North America recorded the lowest at 3.02 PPP dollars per day in 2025.
While the global number of people unable to afford a healthy diet decreased by over 108 million, disparities exist among different income groups. In low-income countries, the number of those who cannot afford a healthy diet rose from 482 million in 2024 to 488 million in 2025. Lower-middle-income countries saw a decline of 78 million people unable to afford healthy diets. Sub-Saharan Africa was unique in that it experienced an increase of 13 million, totaling 954 million people unable to afford a healthy diet, while other regions made progress, with South Asia witnessing a reduction of 72 million.
The prevalence of unaffordability highlights differing conditions. For most groups worldwide, the decline in unaffordability led to a reduction in the absolute number of people unable to afford healthy diets, even as the population grew. However, the low-income group saw minimal improvement, with prevalence decreasing only slightly from 77.5 percent in 2017 to 76.1 percent in 2025, despite a decrease in diet costs.
Indicators of diet costs and affordability reveal two distinct but related dimensions of access to healthy diets. The cost indicator reflects the lowest combination of locally available foods necessary for a healthy diet, while the affordability indicator analyzes this cost against a country’s income distribution, acknowledging that households must meet both food and basic non-food needs.
Countries are categorized based on their diet costs and unaffordability rates, and actions to improve access are suggested: reducing diet costs through better supply chains while increasing purchasing power through job creation and social protection measures.
This year’s CoAHD release includes improvements aimed at refining the quality and transparency of indicators, such as aligning affordability estimates to international poverty lines and enhancing regional and global estimates through population weighting.
The FAO, World Bank, and partners have established a Technical Advisory Group to enhance methodological rigor and quality assurance for future improvements in CoAHD indicators, reflecting a commitment to provide reliable and timely data on healthy diet access.